OpDEA: Optimizing Proteomics Data Differential Expression Analysis via High-Performing Rules and Ensemble Inference
Abstract
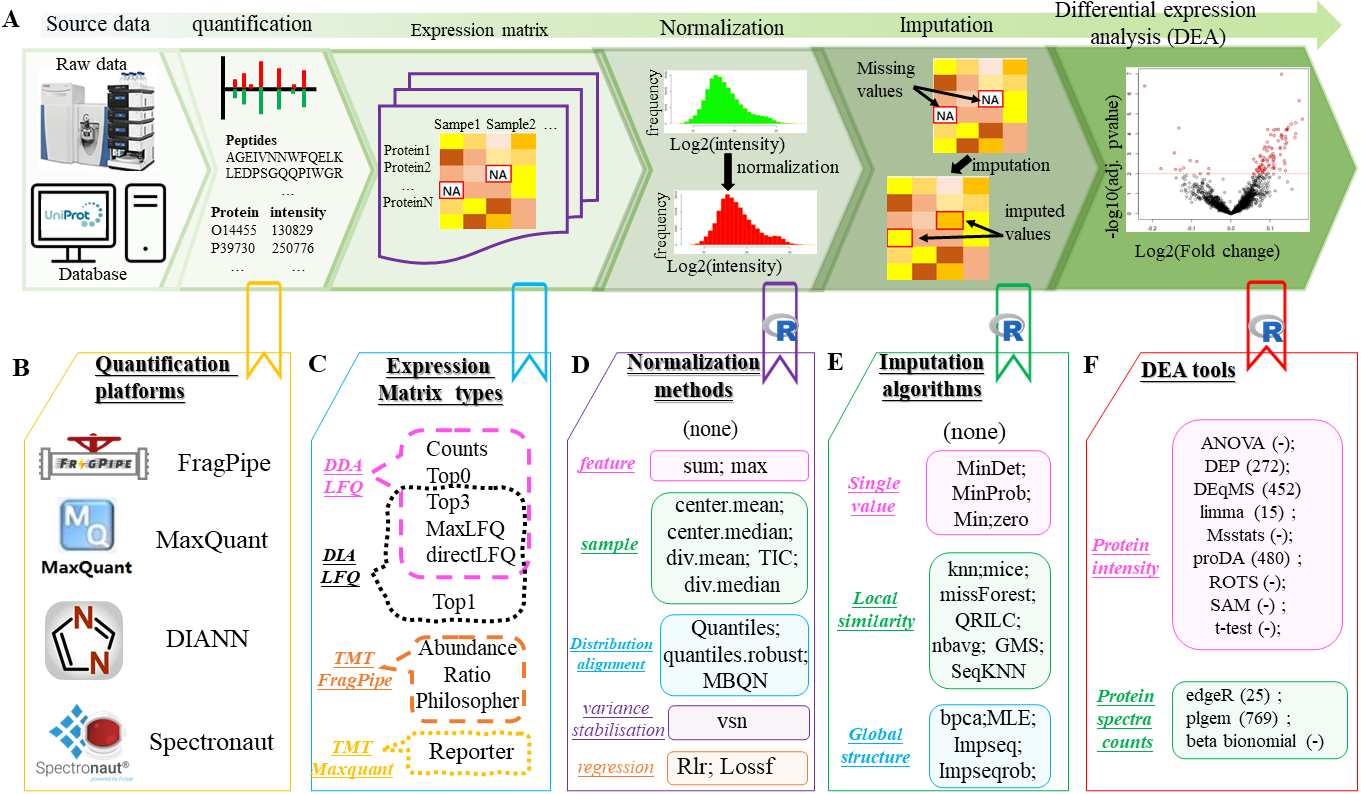
Identification of differentially expressed proteins in a proteomics workflow typically encompasses five key steps: raw data quantification, expression matrix construction, matrix normalization, missing value imputation (MVI), and differential expression analysis. The plethora of options in each step makes it challenging to identify optimal workflows that maximize the identification of differentially expressed proteins. To identify optimal workflows and their common properties, we conduct an extensive study involving 34,576 combinatoric experiments on 24 gold standard spike-in datasets. Applying frequent pattern mining techniques to top-ranked workflows, we uncover high-performing rules that demonstrate optimality has conserved properties. Via machine learning, we confirm optimal workflows are indeed predictable, with average cross-validation F1 scores and Matthew's correlation coefficients surpassing 0.84. We introduce an ensemble inference to integrate results from individual top-performing workflows for expanding differential proteome coverage and resolve inconsistencies. Ensemble inference provides gains in pAUC (up to 4.61%) and G-mean (up to 11.14%) and facilitates effective aggregation of information across varied quantification approaches such as topN, directLFQ, MaxLFQ intensities, and spectral counts. However, further development and evaluation are needed to establish acceptable frameworks for conducting ensemble inference on multiple proteomics workflows.
Workflow of a DEA process for label-free proteomics data and available tools for each step in the workflow
MCP: Mutual complementarity maximization in multi-view proteomics enables robust biomarker prediction
Abstract
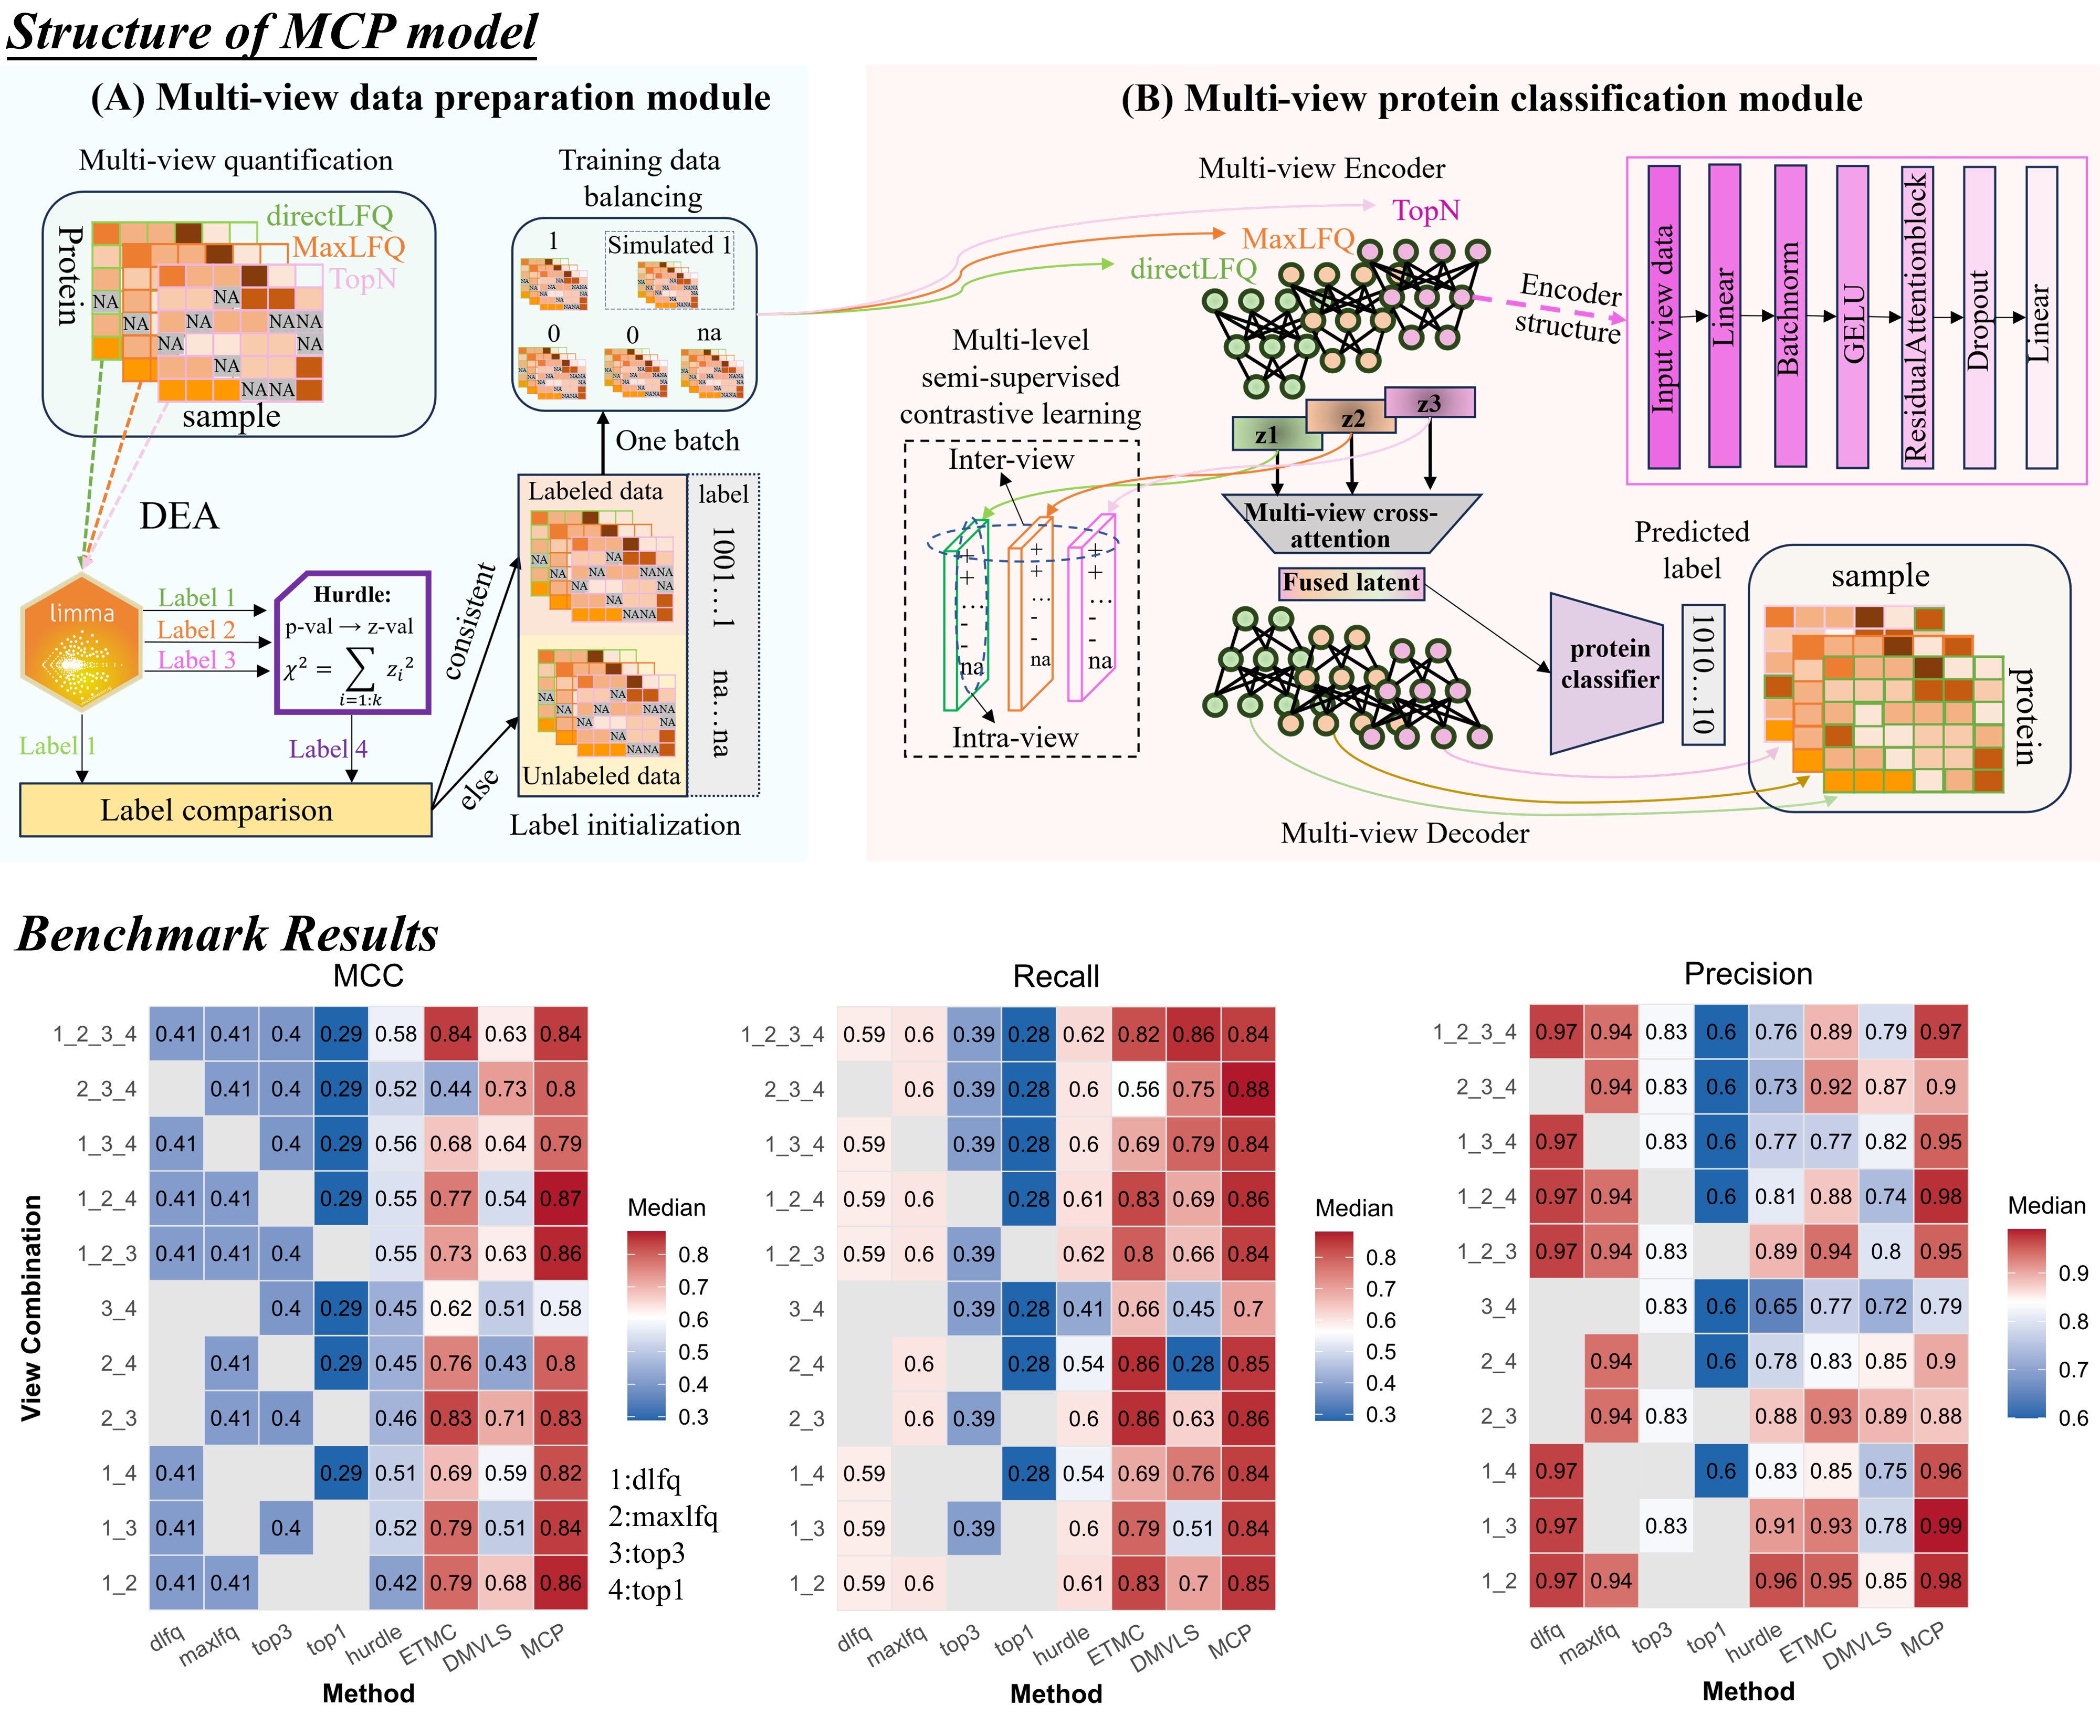
Mass spectrometry (MS)-based proteomic quantification is a multi-dimensional problem. Current approaches focus only on single dimensions (views), which is a limited representation of the underlying proteome. Distinct quantification modes (“views”) encodes complementary biological information, but each view is separately explored and not well-integrated. This has led towards biased single-view studies in comparative proteomic analysis, including the identification of differentially expressed proteins (DEPs), which are important for drug target discovery and disease diagnosis. To exploit mutual multi-view complementarity, we introduce Multi-view Contrastive Proteomics (MCP), a semi-supervised representation learning framework that integrates these heterogeneous quantification views into a shared embedding space through contrastive learning. MCP’s novelty lies in the explicit modeling of cross-view interactions while mitigating label scarcity, technical noise, and class imbalance. By jointly leveraging complementary views rather than treating them independently, MCP maximizes biologically meaningful data for DEP detection. Benchmarked on 18 gold-standard spike-in datasets, MCP consistently predicted more true DEPs, achieving >20% increase in recall while maintaining precision (>90%) in comparison with prevailing statistical and machine learning baselines. MCP also provides interpretable insights into cross-view interactions, revealing deeper structural mechanisms underpinning proteomic data. When applied to clinical proteomics cohorts, MCP unlocks previously inaccessible biological signals: robustly identifying unique DEPs that enhance thyroid nodule stratification. MCP also identified VSIG4, a macrophage immune suppressive regulator, as a novel prognostic biomarker for colorectal cancer that was missed by conventional approaches; in perturbation studies, MCP recovers more validated IFN-γ-responsive proteins and pathways from both bulk and single-cell proteomics, confirming the roles by perturbation modeling and virtual cell generation. Overall, MCP establishes a general computational paradigm for complementarity maximization in multi-view proteomic data analysis, enabling deeper biological understanding and translational impact. MCP is available at http://www.ai4pro.tech:3838.
MCP-structure and benchmarking results
M-VIDIA: A Multi-View representation to Increase modality Depth using Integrative AI
Abstract
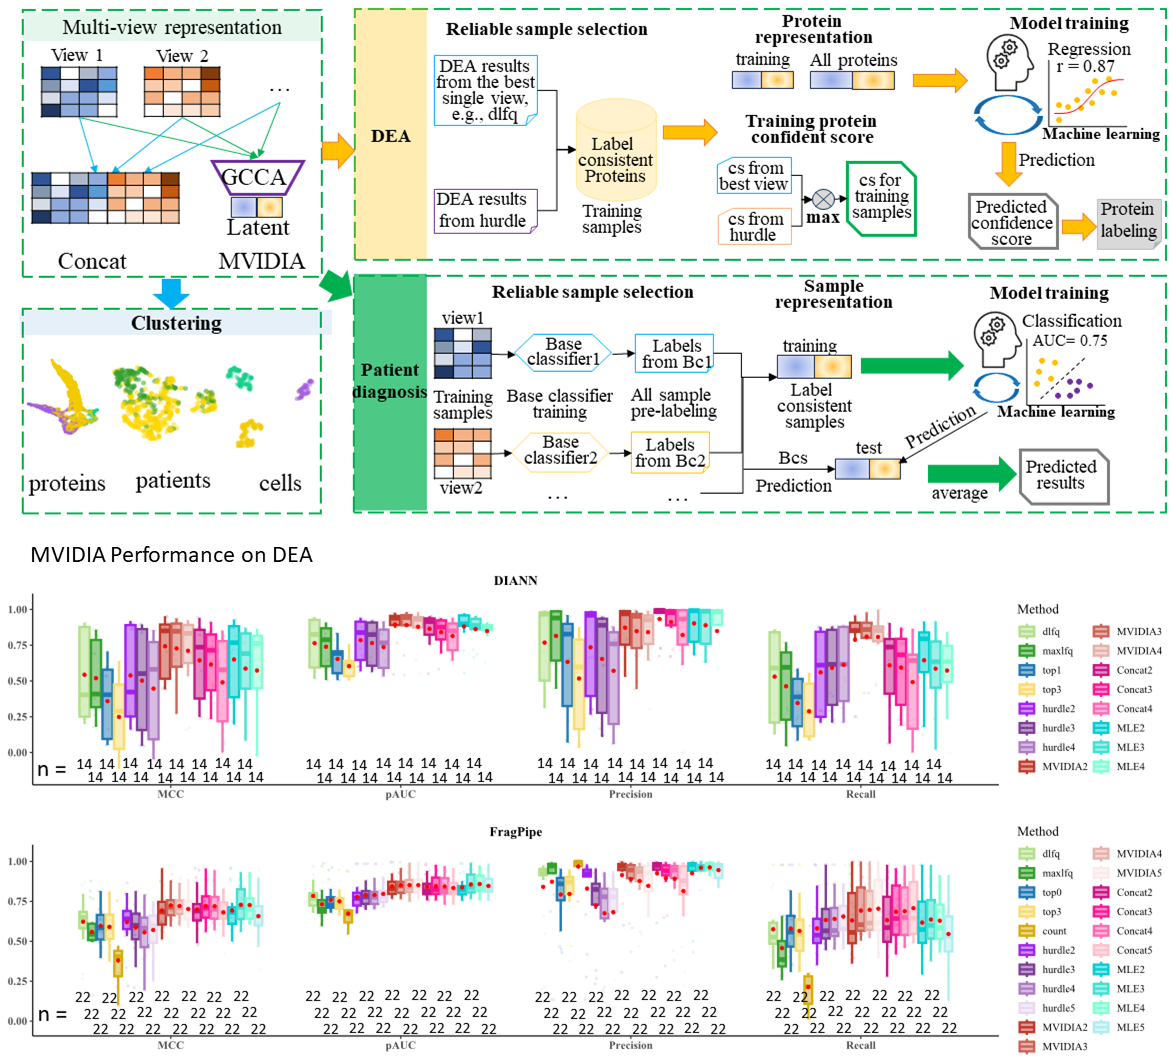
Artificial intelligence (AI) models are powerful tools for addressing data challenges such as complexity, sparsity, and noise. Multi-view learning (MVL), which leverages multiple data representations (“views”), holds great potential by enhancing signal quality and improving task performance. However, its application in biomedical research remains largely underexplored. To address this gap, we introduce Multi-View representation to Increase Modality Depth using Integrative AI (M-VIDIA), a novel MVL framework. M-VIDIA integrates diverse views to boost performance across various tasks, including differential expression analysis, patient diagnosis, and cell clustering. Our findings demonstrate that M-VIDIA consistently outperforms other approaches, significantly improving sensitivity and signal quality. This represents a major advancement in data-driven AI, highlighting the crucial role of high-quality data representation in producing reproducible and interpretable results in biomedical research. M-VIDIA is available for use at http://www.ai4pro.tech:3838/.
Overall pipeline of M-VIDIA and its performance on DEA
Acknowledgement and Citation
Acknowledgement
This research/project is supported by the National Research Foundation, Singapore under its Industry Alignment Fund – Prepositioning (IAF-PP) Funding Initiative. Any opinions, findings and conclusions or recommendations expressed in this material are those of the author(s) and do not reflect the views of National Research Foundation, Singapore.
This work was partly supported by the National Innovation Fellow Program of the MOST of China (J.L., Grant No. E327130001).
WWBG also acknowledges support from an MOE Tier 1 award (RS08/21).
Publication
Please cite the following papers:
Hui Peng, He Wang, Weijia Kong, Jinyan Li*, Wilson Wen Bin Goh*. (2024). Optimizing differential expression analysis for proteomics data via high-performing rules and ensemble inference. Nat Commun 15, 3922 (2024). https://doi.org/10.1038/s41467-024-47899-w
Hui Peng, Hexin Cai, Shifu Luo, Jinyan Li*, Wilson Wen Bin Goh*. (2026). Mutual complementarity maximization in multi-view proteomics enables robust biomarker prediction.
Hui Peng, Wilson Wen Bin Goh*. (2024). M-VIDIA: A Multi-View representation to Increase modality Depth using Integrative AI.
FragPipe workflow benchmarking results with label-free DDA data
Maxquant workflow benchmarking resultswith label-free DDA data
DIA-NN workflow benchmarking results with label-free DIA
Spectronaut workflow benchmarking results with label-free DIA
FragPipe workflow benchmarking results with TMT data
Maxquant workflow benchmarking results with TMT data
Recommend optimal Workflow for DDA label-free data
We highly recommend you to use our offline tool or R package instead for testing DEA workflows !!! (see following link:)
offline OpDEA toolkit: OpDEA toolkit
R package: R package
Do you have any preferred selections?
click the botton again to hide !!!
ensemble inference may help improve the true positive rates, Do you help try it?
click the botton again to hide !!!
We suggest to apply the FragPipe-specific top-ranked workflow:
DEqMS|FragPipe|dlfq|missForest|blank: expression matrix:dlfq normalization:None MVI:missForest DEA tool:DEqMS
or your can apply one of the workflows including the following choices:
expression matrix: [directLFQ] intensity normalization: None MVI: [SeqKNN] DEA tool: [limma, ROTS]
You can view the details of your selected workflow in benchmarking-DDA_LFQ-FragPipe page
thresholds:
Volcano plot of the differential expression analysis (DEA)
Per your info, our suggestions are as follows:
You can view the details of this workflow in benchmarking-DDA_LFQ-FragPipe page
thresholds:
Volcano plot of the differential expression analysis (DEA)
We suggest to use the following workflows to conduct ensemble inference:
thresholds:
Volcano plot of the differential expression analysis (DEA)
please check in which step:
expression matrix types
Normalization methods
MVI algorithms
DEA tools
Do you have any preferred selections?
click the botton again to hide !!!
ensemble inference may help improve the true positive rates, Do you help try it?
click the botton again to hide !!!
We suggest to apply the maxquant-specific top-ranked workflow:
DEqMS|Maxquant|dlfq|Impseq|blank: expression matrix:dlfq normalization:None MVI:Impseq DEA tool:DEqMS
or your can apply one of the workflows including the following choices:
expression matrix: directLFQ intensity normalization: [None] MVI: [Impseq] DEA tool: limma
You can view the details of your selected workflow in benchmarking-DDA_LFQ-Maxquant page
thresholds:
Volcano plot of the differential expression analysis (DEA)
Per your info, our suggestions are as follows:
You can view the details of this workflow in benchmarking-DDA_LFQ-Maxquant page
thresholds:
Volcano plot of the differential expression analysis (DEA)
We suggest to use the following workflows to conduct ensemble inference:
thresholds:
Volcano plot of the differential expression analysis (DEA)
please check in which step:
expression matrix types
Normalization methods
MVI algorithms
DEA tools
Recommend optimal Workflow for DIA label-free data
We highly recommend you to use our offline tool or R package instead for testing DEA workflows !!! (see following link:)
offline OpDEA toolkit: OpDEA toolkit
R package: R package
Do you have any preferred selections?
click the botton again to hide !!!
ensemble inference may help improve the true positive rates, Do you help try it?
click the botton again to hide!!!
We suggest to apply the DIA-NN-specific top-ranked workflow:
limma|DIANN|dlfq|MinDet|blank: expression matrix:dlfq normalization:None MVI:MinDet DEA tool:limma
or your can apply one of the workflows including the following choices:
expression matrix: "directLFQ intensity" normalization: [None] MVI: [MinDect] DEA tool: [limma]
You can view the details of your selected workflow in benchmarking-DIA_LFQ-DIANN page
thresholds:
Volcano plot of the differential expression analysis (DEA)
Per your info, our suggestions are as follows:
You can view the details of this workflow in benchmarking-DIA_LFQ-DIANN page
thresholds:
Volcano plot of the differential expression analysis (DEA)
We suggest to use the following workflows to conduct ensemble inference:
thresholds:
Volcano plot of the differential expression analysis (DEA)
please check in which step:
expression matrix types
Normalization methods
MVI algorithms
DEA tools
Do you have any preferred selections?
click the botton again to hide!!!
ensemble inference may help improve the true positive rates, Do you help try it?
click the botton again to hide!!!
We suggest to apply the Spectronaut-specific top-ranked workflow:
limma|DIANN|dlfq|MinDet|blank: expression matrix:dlfq normalization:None MVI:MinDet DEA tool:limma
or your can apply one of the workflows including the following choices:
expression matrix: "directLFQ intensity" normalization: [None] MVI: [Impseq] DEA tool: [ROTS, limma]
You can view the details of your selected workflow in benchmarking-DIA_LFQ-Spectronaut page
thresholds:
Volcano plot of the differential expression analysis (DEA)
Per your info, our suggestions are as follows:
You can view the details of this workflow in benchmarking-DIA_LFQ-Spectronaut page
thresholds:
Volcano plot of the differential expression analysis (DEA)
We suggest to use the following workflows to conduct ensemble inference:
thresholds:
Volcano plot of the differential expression analysis (DEA)
please check in which step:
expression matrix types
Normalization methods
MVI algorithms
DEA tools
Recommend optimal Workflow for TMT data
We highly recommend you to use our offline tool or R package instead for testing DEA workflows !!! (see following link:)
offline OpDEA toolkit: OpDEA toolkit
R package: R package
Do you have any preferred selections?
click the botton again to hide !!!
We suggest to apply the TMT-FragPipe-specific top-ranked workflow:
limma|FragPipe|abd|SeqKNN|blank: expression matrix:abd normalization:None MVI:SeqKNN DEA tool:limma
or your can apply one of the workflows including the following choices:
expression matrix: TMT-Integrator abundance normalization: None MVI: [SeqKNN] DEA tool: limma
You can view the details of your selected workflow in benchmarking-TMT-FragPipe page
You can view the details of this workflow in benchmarking-DIA_LFQ-Spectronaut page
thresholds:
Volcano plot of the differential expression analysis (DEA)
Per your info, our suggestions are as follows:
You can view the details of your selected workflow in benchmarking-TMT-FragPipe page
You can view the details of this workflow in benchmarking-DIA_LFQ-Spectronaut page
thresholds:
Volcano plot of the differential expression analysis (DEA)
please check in which step:
expression matrix types
Normalization methods
MVI algorithms
DEA tools
Do you have any preferred selections?
click the botton again to hide !!!
We suggest to apply the TMT-Maxquant-specific top-ranked workflow:
proDA|Maxquant|intensity|bpca|blank: expression matrix:intensity normalization:None MVI:bpca DEA tool:proDA
or your can apply one of the workflows including the following choices:
expression matrix: Reporter intensity normalization: None MVI: [bpca] DEA tool: [limma, ROTS]
You can view the details of your selected workflow in benchmarking-TMT-FragPipe page
You can view the details of this workflow in benchmarking-DIA_LFQ-Spectronaut page
thresholds:
Volcano plot of the differential expression analysis (DEA)
Per your info, our suggestions are as follows:
You can view the details of this workflow in benchmarking-TMT-FragPipe page
You can view the details of this workflow in benchmarking-DIA_LFQ-Spectronaut page
thresholds:
Volcano plot of the differential expression analysis (DEA)
please check in which step:
Normalization methods
MVI algorithms
DEA tools
Extracting views for M-VIDIA
This page provides the function of extracting view data from raw quantification outputs
!!! We strongly recommend using our offline tool (zendo: OpDEA-MCP @ https://zenodo.org/records/19477436) to extract views as the process is time consuming especially for DIA data:
example raw quantification data:
Download from zenodo via the following link
Zenodo: example_raw_quantification.zip;FragPipe-DDA quantification
Maxquant-DDA quantification
DIA-NN-DIA quantification
Spectronaut-DIA quantification
please provide following file paths.
For Spectronaut, please Use this export schema iq.rs to make a long report, as we use 'iq' R package to extract the views. See https://github.com/tvpham/iq.
please choose views you want to extract
MCP for proteomics data DEA
Input files
!!!please prepare required files per following instructions.
Please provide view files
File preparation instructions:Step 1. Extraction of views from raw quantification outputs. Please extract all available views!!!
We provide a module helping extract views from your proteomics data and use them as inputs to MCP. see View Extraction page.
example view data:
Download from zenodo via the following link
Zenodo: views.zip;Step 2. Select all available view files from Step 1.
Step 3. Preparing a design.tsv file with at least columns of sample_name, condition, and replicate name, the sample name should be the name as the view file column names for intensities
Step 4. Compressing the view files and design file to a views.zip file.
Parameters
Volcano plot of the differential expression analysis (DEA)
M-VIDIA for proteomics data analysis
Input files
!!!please prepare required files per following instructions.
Please provide view files
File preparation instructions:Step 1. Extraction of views from raw quantification outputs.
We provide a module helping extract views from your proteomics data and use them as inputs to MVIDIA. see View Extraction page.
example view data:
Download from zenodo via the following link
Zenodo: views.zip;Step 2. Select view files e.g., e.g., dlfq.tsv, maxlfq.tsv, etc. from Step 1.
Step 3. Preparing a design.tsv file with at least columns of sample_name, condition, and replicate name, the sample name should be the name as the view file column names for intensities
Step 4. Compressing the view files and design file to a views.zip file.
Parameters
Volcano plot of the differential expression analysis (DEA)
M-VIDIA for Disease diagnosis
Input files
!!!please prepare required files per following instructions.
Please provide view files
File preparation instructions:Step 1. Extraction of views from raw quantification outputs.
We provide a module helping extract views from your proteomics data and use them as inputs to MVIDIA. see View Extraction page.
example view data:
Download from zenodo via the following link
Zenodo: train.zip;Download from zenodo via the following link
Zenodo: test.zip;Step 2. Select a group of training view files e.g., e.g., dlfq.tsv, maxlfq.tsv, etc. from training views extracted from Step 1.
Step 3. Preparing a design.tsv file for training data, with at least columns of sample_name, sample_ID, and class, the sample_name should be the name as the view file column names for intensities
Step 4. Compressing the training view files and design file to a train_views.zip file.
Step 5. Select the same group of test view files e.g., e.g., dlfq.tsv, maxlfq.tsv, etc. from testing views extracted from Step 1.
Step 6. Preparing a design.tsv file for testing data, with at least columns of sample_name and sample_ID, the sample_name should be the name as the view file column names for intensities
Step 7. Compressing the testing view files and design file to a test_views.zip file.
Parameters
M-VIDIA for cell clustering
Input files
!!!please prepare required files per following instructions.
Please provide view files
File preparation instructions:Step 1. Extraction of views from raw quantification outputs.
We provide a module helping extract views from your proteomics data and use them as inputs to MVIDIA. see View Extraction page.
example view data:
Download from zenodo via the following link
Zenodo: sc.zip;Step 2. Select view files e.g., e.g., dlfq.tsv, maxlfq.tsv, etc. from Step 1. (also can provide a design file with true labels.)
Step 3. Compressing the view files to a single .zip file.
Parameters
Avaliable Resources
Raw data links for DEA workflow benchmarking
label-free DDA data
HYE5600735_LFQ: PXD028735
HYE6600735_LFQ: PXD028735
HYEqe735_LFQ: PXD028735
HYEtims735_LFQ: PXD028735
HYtims134_LFQ: PXD036134
HEtims425_LFQ: PXD021425;
YUltq006_LFQ: PDC000006
YUltq099_LFQ: PXD002099
YUltq819_LFQ: PXD001819
HEqe408_LFQ: PXD018408
HYqfl683_LFQ: PXD007683
HYEtims777_LFQ: PXD014777;
label-free DIA data
HYEtims735_DIA: PXD028735
MYtims709_DIA: PXD034709
HEqe408_DIA: PXD018408
HEof_n600_DIA: PXD026600
HEof_w600_DIA: PXD026600
HYtims134_DIA: PXD036134
HEqe777_DIA: PXD019777
HEqe777_DIA:
TMT data
HEqe277_TMT10: PXD013277
HYqfl683_TMT11: PXD007683
HYms2faims815_TMT16: PXD020815
HYsps2815_TMT16: PXD020815
HYms2815_TMT16: PXD020815
Quantification data for DEA workflow benchmarking
Please download from zenodo via the following link
Zenodo: Raw quantification results from FragPipe, Maxquant, DIA-NN and SpectronautOr download from google drive via the following link
google Drive: Raw quantification results of DDA data; DIA data; TMT dataDEA workflow benchmarking result data
expression matrices are available at:
Download from zenodo via the following link
Zenodo: DDA_expression_matrices;Download from zenodo via the following link
Zenodo: DIA_expression_matrices;Download from zenodo via the following link
Zenodo: TMT_expression_matrices;Performance metrices are available at:
Download from zenodo via the following link
Zenodo: DDA_performance_metrics;Download from zenodo via the following link
Zenodo: DIA_performance_metrics;Download from zenodo via the following link
Zenodo: TMT_performance_metrics;Workflow ranks are available at:
Download from zenodo via the following link
Zenodo: DDA_workflow_ranks;Download from zenodo via the following link
Zenodo: DIA_workflow_ranks;Download from zenodo via the following link
Zenodo: TMT_workflow_ranks;view data for MCP benchmarking and case studies
The view data and desing files are available at:
Download from zenodo via the following link
Zenodo: views for MCP;view data for MCP and M-VIDIA case studies
view data for Thyroid Nodule Classification (TNC) dataset are available at:
Download from zenodo via the following link
Zenodo: discovery set;Download from zenodo via the following link
Zenodo: retrospective test set;Single Mouse Oocytes (SMO) data are available at:
Download from zenodo via the following link
Zenodo: proteomics;Download from zenodo via the following link
Zenodo: transcriptomics;Pick-up Single-cell Proteomic Analysis (PiSPA) dataset are available at:
Download from zenodo via the following link
Zenodo: single cell DDA;Download from zenodo via the following link
Zenodo: single cell DIA;Introduction of the webserver
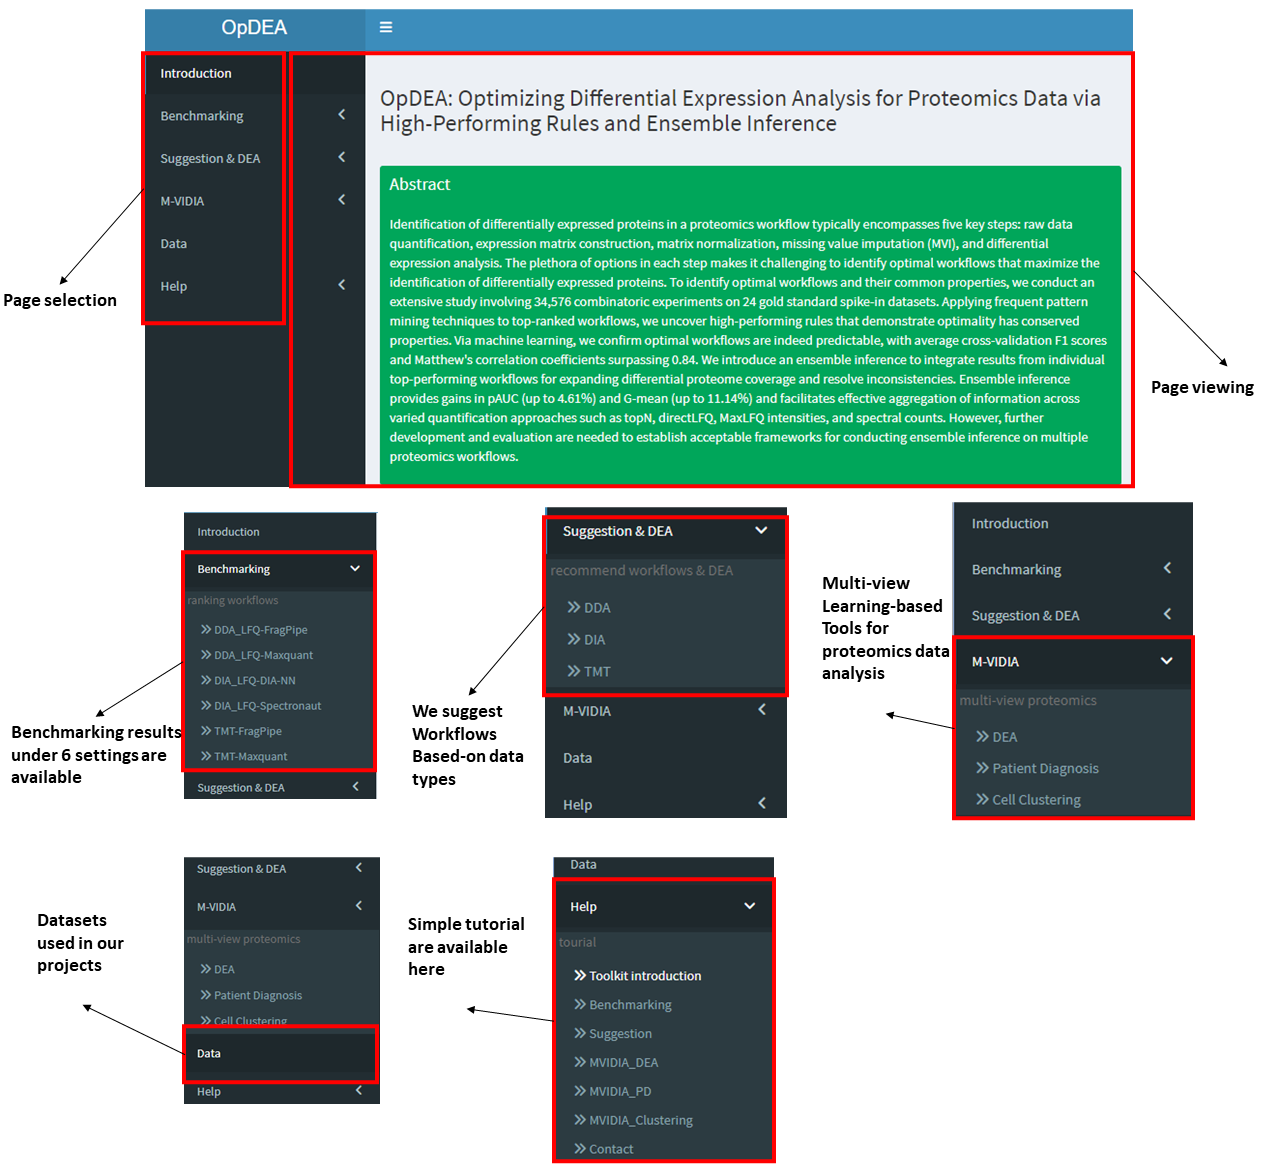
This toolkit includes 6 main function panels including Introduction, Benchmarking, Suggestion & DEA, Multi-view Proteomics, Data and Help. In the [Introduction] panel, we first present the abstract of this work, then we show an overview of the proteomics data differential expression analysis workflow and the options available in each workflow steps. We later present the abstract of our newly design multi-view learning framework for proteomics data analysis together with the pipeline of the MVIDIA. At last, the Acknowledgement and Citation information are shown.
In the [Benchmarking] panel,
users can view our benchmarking results including checking the rank position and performance metric values of a workflow tested with our benchmaking datasets.
In the [Suggestion & DEA] panel,
we provide the tools for suggesting optimal workflows and conduct differential expression analysis with the suggested workflow directly.
In the [Multi-view Proteomics] panel,
we provide four functional modules for completing proteomics data analysis tasks such as DEA (with MCP or MVIDIA), patient diagnosis and cell clustering.
In the [Data] panel,
the user can get the links where raw proteomics data are available. The raw quantification results of the raw data, the extracted expression matrices and our benchmarking results can be downloaded.
The data used in our case studies in our MCP and MVIDIA paper are provided.
We also provide the link for downloading our offline toolkit with the same function as the webserver.
offline toolkit: OpDEA-MCP OpDEA-MCP
In the [Help] panel,
We introduce the webserver and show what the users can do with our toolkit
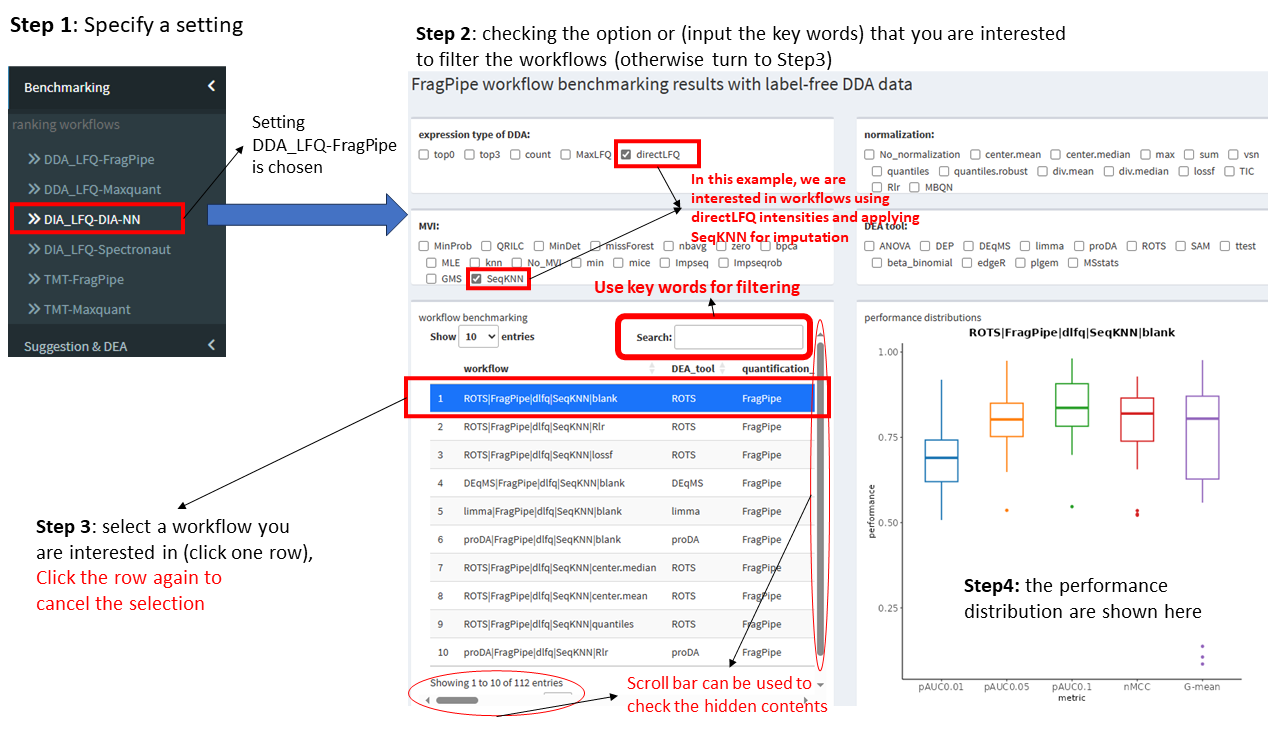
View benchmarking results
Step 1: Choosing an interested setting, e.g., label-free DDA data quantified with FragPipe, click the item of DDA_LFQ-FragPipe.
There are 7852, 7852, 6284, 6284, 4720 and 1568 workflows under settings of LFQ_DDA-FragPipe, LFQ_DDA-Maxquant, LFQ_DIA-DIANN, LFQ_DIA-Spectronaut, TMT-FragPipe and TMT-Maxquant.
Step 2: Filtering workflows, e.g., check the options in the 4 checkboxes that you are interested in, or by using a key word.
Drag the scroll bar below the table can check the ranking with a specific metric. The ranking of workflows is based-on the average ranking based on the five performance metrics (the column of avg_rank_mean).
Step 3: Click one row of the table to check the performance distributions testing on different datasets.
12 DDA datasets, 7 DIA datasets and 5 TMT datasets were used to evaluate the performances of workflows, the boxplot shows the performance distributions of the 5 metrics.
Only one row is permitted to be select each time, click the same row twice can cancel the selection.
Step 4: View the details of performance distrubutions of the five metrics in the right bottom figure.
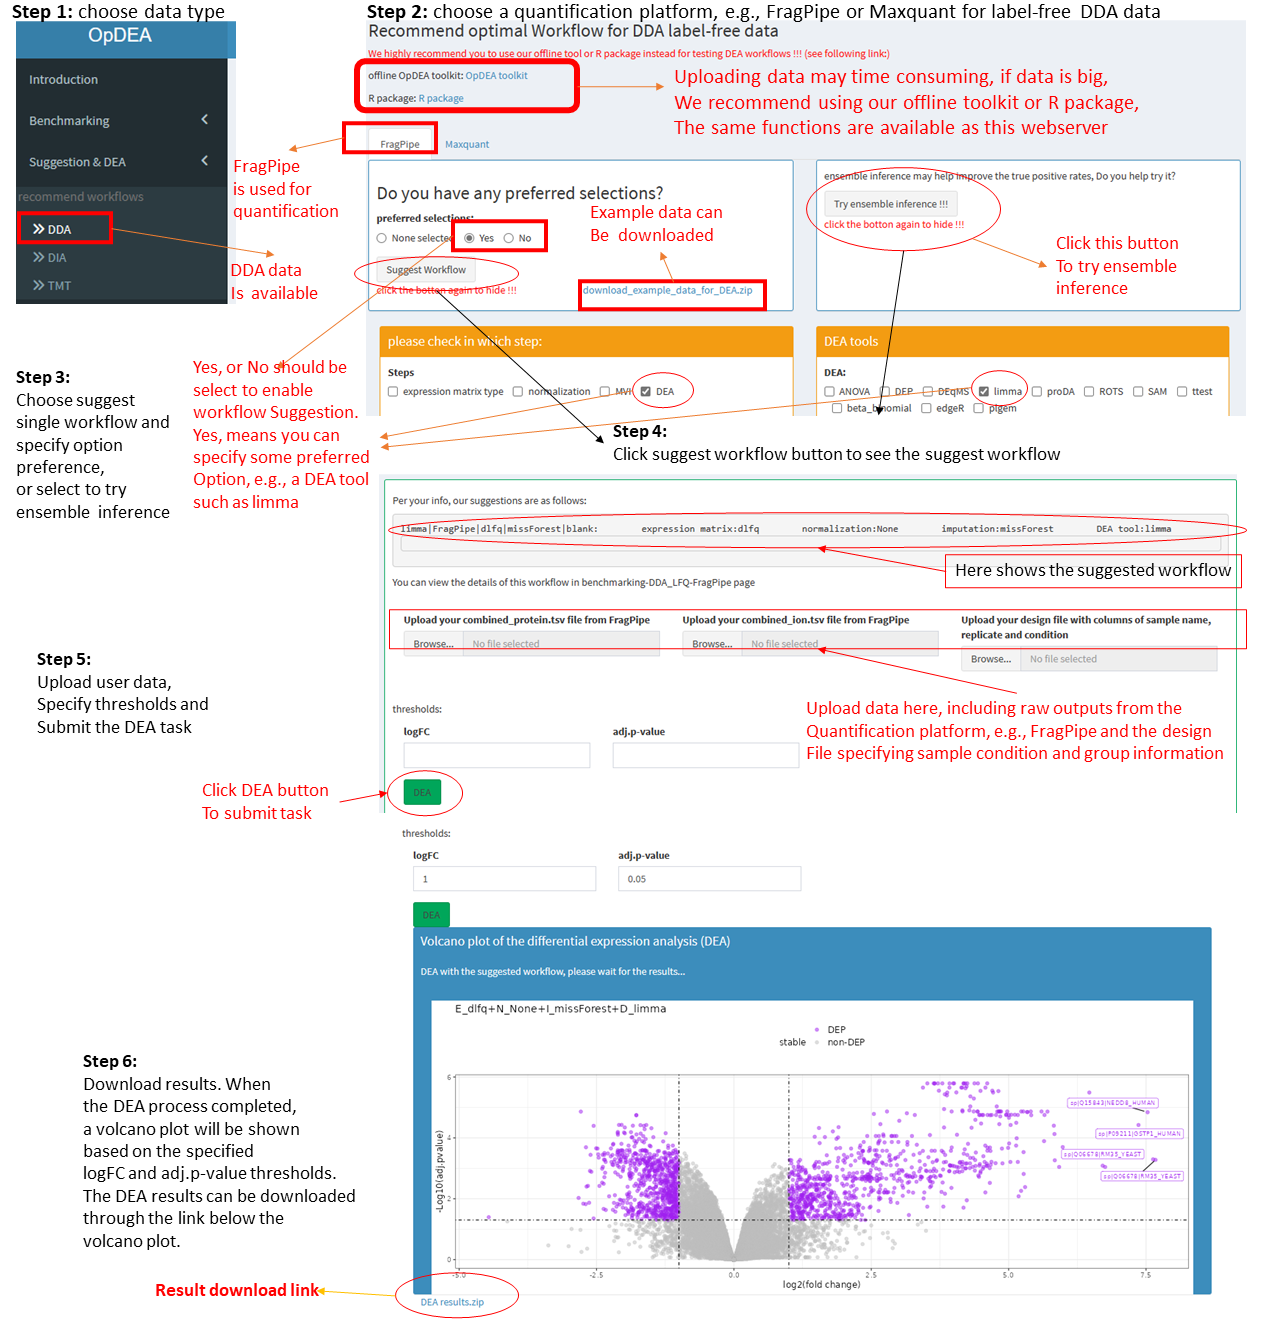
Optimal workflow recommendation & DEA
Step 1: Choose data type that the user has.
Lable-free DDA (DDA), label free DIA (DIA) and TMT data are supported. Choose the one correponding to the data you have.
Step 2: Choose a quantification platform.
For DDA data, FragPipe and Maxquant are supported. For DIA data, DIA-NN and Spectronaut are supported. For TMT data, again, FragPipe and Maxquant are supported. Just choose the one that you used to quantify your proteomics data.
Step 3: Choose to suggest single workflow or try the ensemble inference.
If single workflow is preferred. The user should choose whether the have some preferred options in the workflow step. If yes, then check Yes, and select the options in below checkboxes, otherwise select No.
For DDA and DIA data, our server also support to suggest ensemble inference where multiple workflow are integrated by a p-value integration method. The ens_multi-quant approach is used defaulty.
The imputation method missForest and MLE are quite time-consuming, if they are suggested, we will replace them with MinProb.
Step 4: Click the suggest worklfow button or Try ensemble inference button.
Our server will suggest the top 1st workflow after filtering the workflows with user specified option preference. The potential alternative options will also be shown according to our option comparsion results
Step 5: Upload raw quantification result data, specify thresholds and submit the DEA task.
The user should upload their raw quantification result data for DEA, e.g., the combined_protein.tsv file from FragPipe. The designed file showing the sample condition and group information must be uploaded at the same time. Read the file requirement carefully before uploading your files. The log2FC threshold and adj.pvalue (p-value is ajusted with BH method) threshold should be specified. At last, click DEA button to submit the task.
Step 6: Download DEA results.
After submitting the DEA task, the user should wait for a while till the task being completed. A volcano plot will be generated and a link for the user downloading their DEA results can be found below the volcano plot.
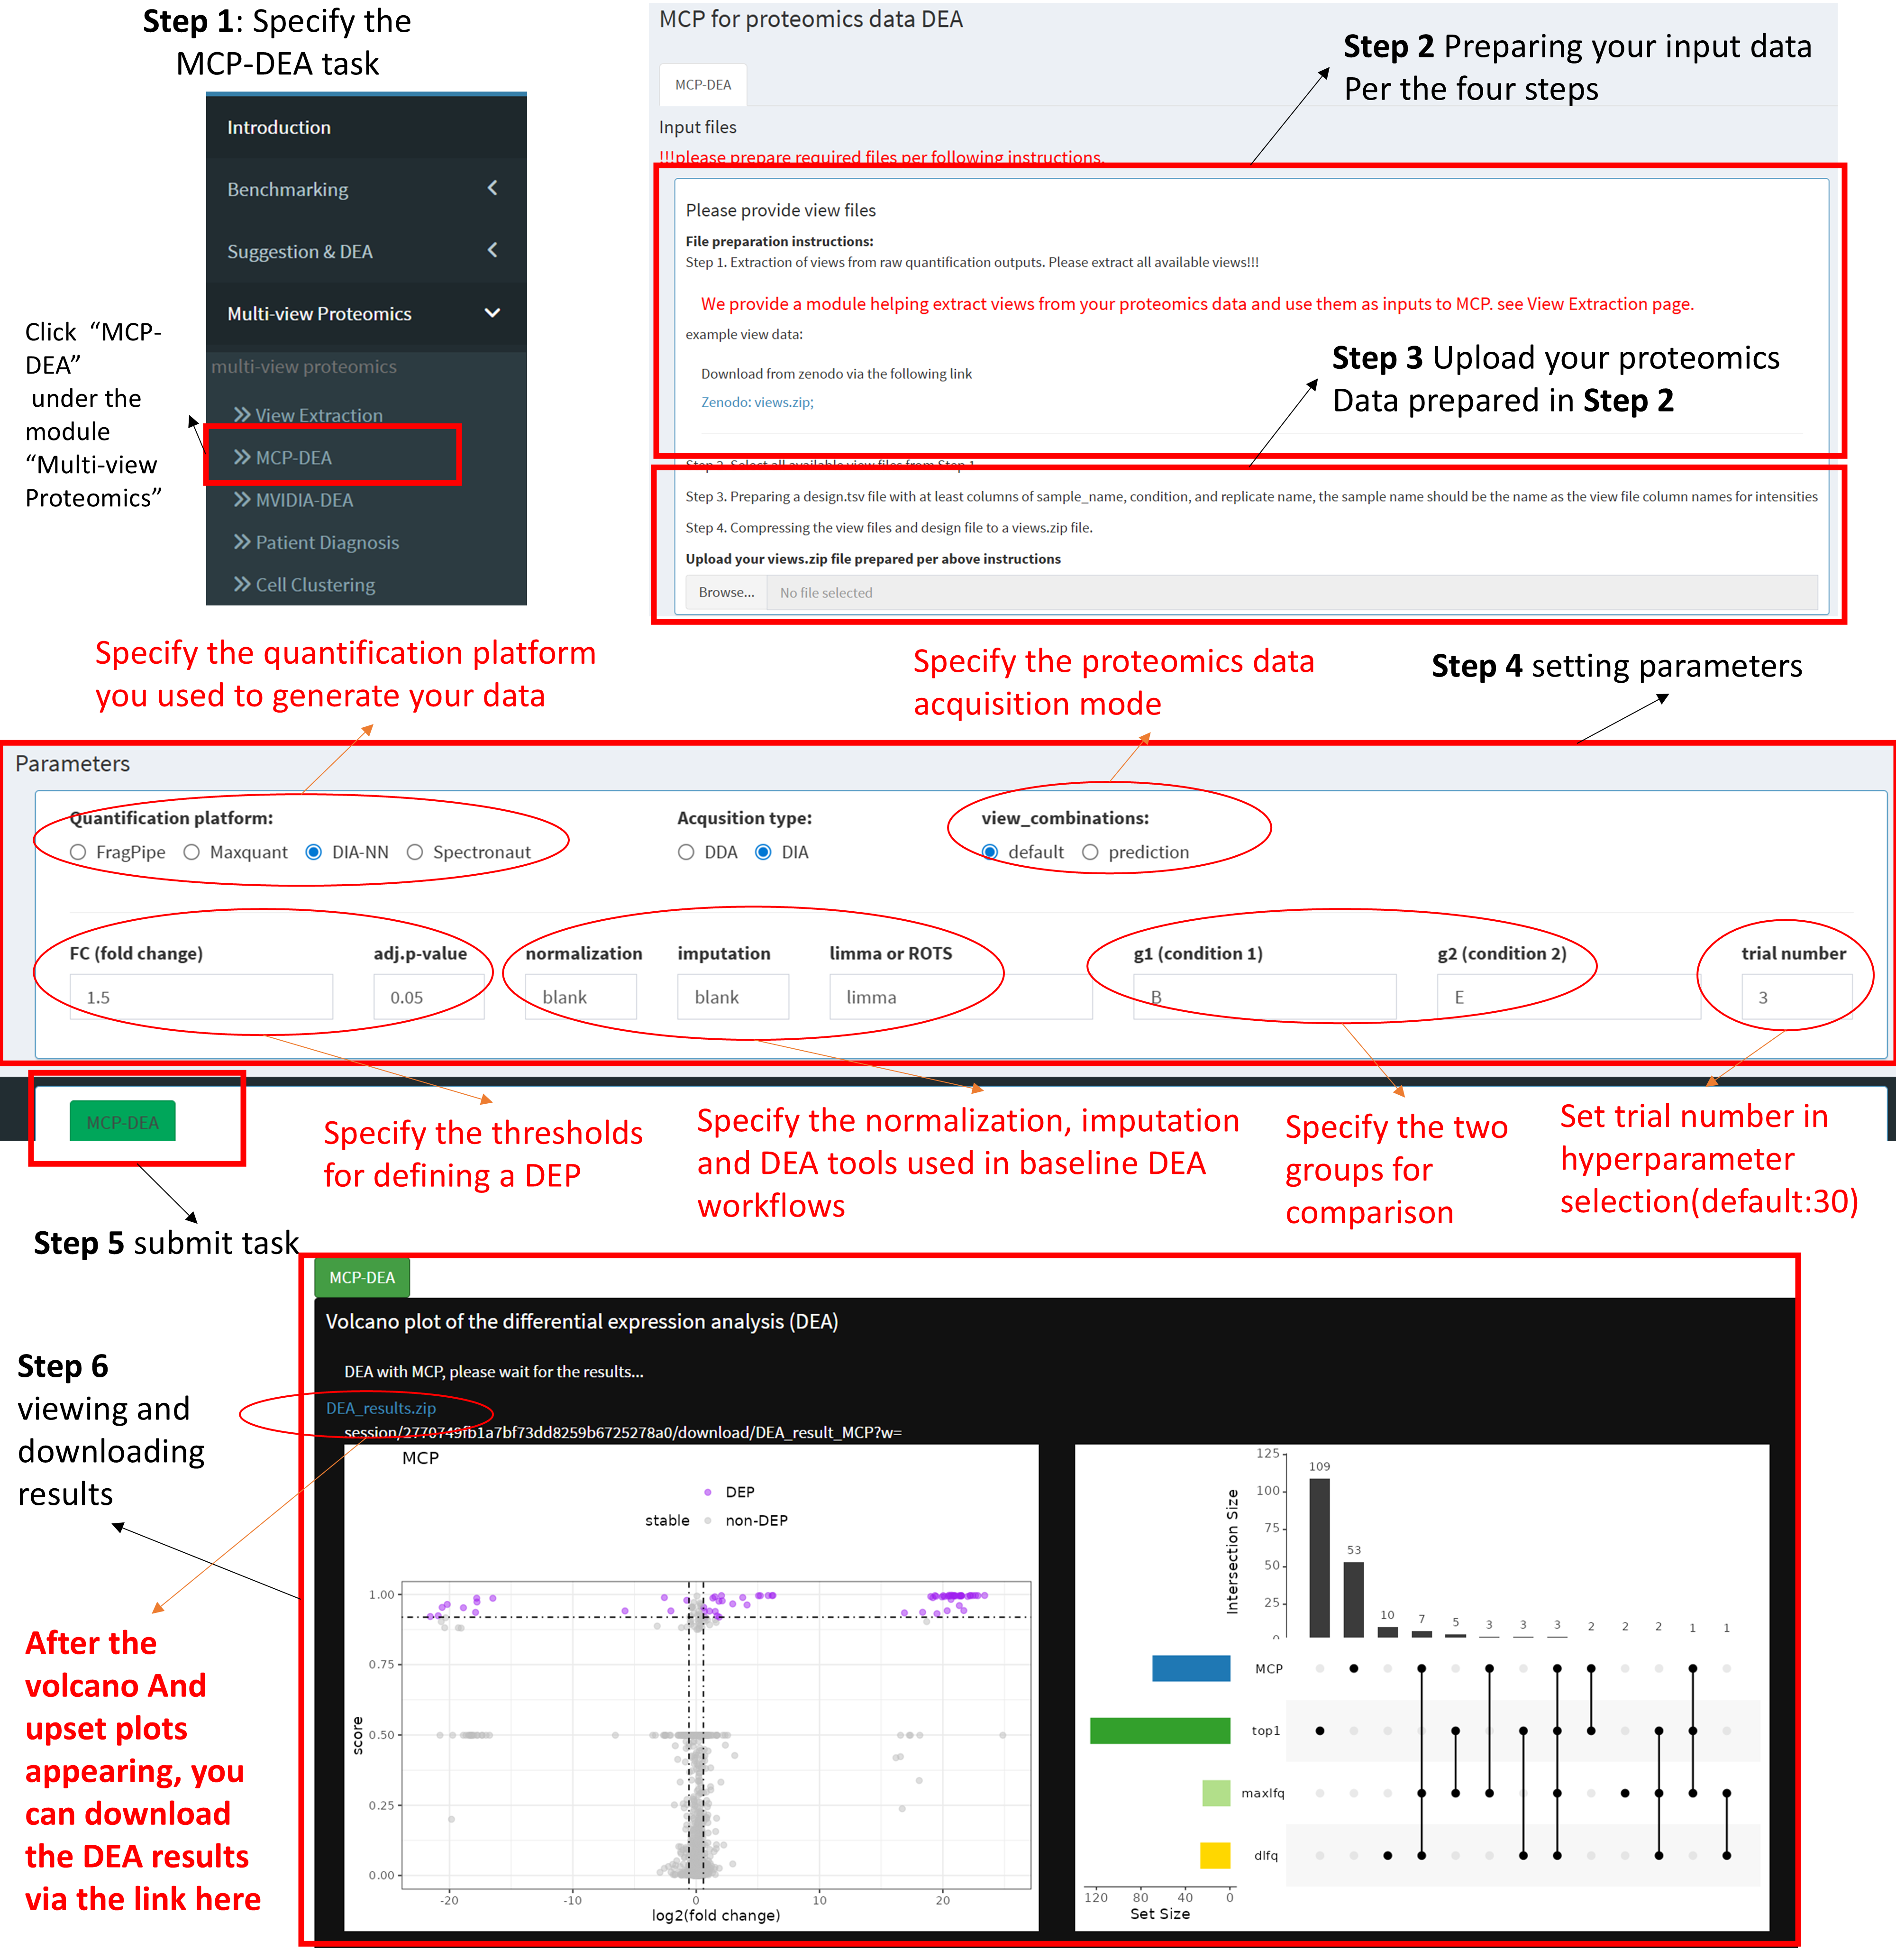
MCP DEA
Step 1: Choose the task "MCP-DEA" under "Multi-view Proteomics" in the left menu.
Step 2 Preparing your input data.
We provide a module helping extract views from your proteomics data and use them as inputs to MCP. see "View Extraction" page. Please extract all available views, e.g., dlfq|maxlfq|top3|top1 for DIA and dlfq|maxlfq|top0|top3|count for DDA.
Please also prepare a design.tsv file with at least columns of sample_name, condition, and replicate name, the sample name should be the name as the view file column names for intensities.
Step 3: File upload.
After extracting all the view data, Compressing the view files (e.g., dlfq.tsv, maxlfq.tsv, etc.) and the design file (design.tsv) to a zip file named "views.zip". Then, upload the zip file to the server.
Step 4: Setting the parameters.
A.) Please specify the parameters including:
B.) Quantification platform, e.g., FragPipe for DDA data, DIA-NN for DIA data, etc.
C.) proteomics data acqusition mode, DDA or DIA
D.) The thesholds for defining differentially expressed proteins (DEPs), including the logFC and the adj.pvalue.
E.) Specifying whehter the data should be normalized and the missing values should be imputed. Avaialbe options please see the pages in Benchmarking. blank is set as default
F.) Specify the group label that you are willing to compare, e.g., A, B.
G.) Set the trial number in hyperparameter optimization.
Step 5: After specifying the parameters, please click the MCP-DEA button to submit the task.
Step 6: Check DEA results.
After submitting the DEA task, the user should wait for a while till the task being completed. A volcano plot and the a venn plot showing the DEP overlaps obtained by single view methods and the multi-view method will be generated. The result file can be downloaded through the blue link.
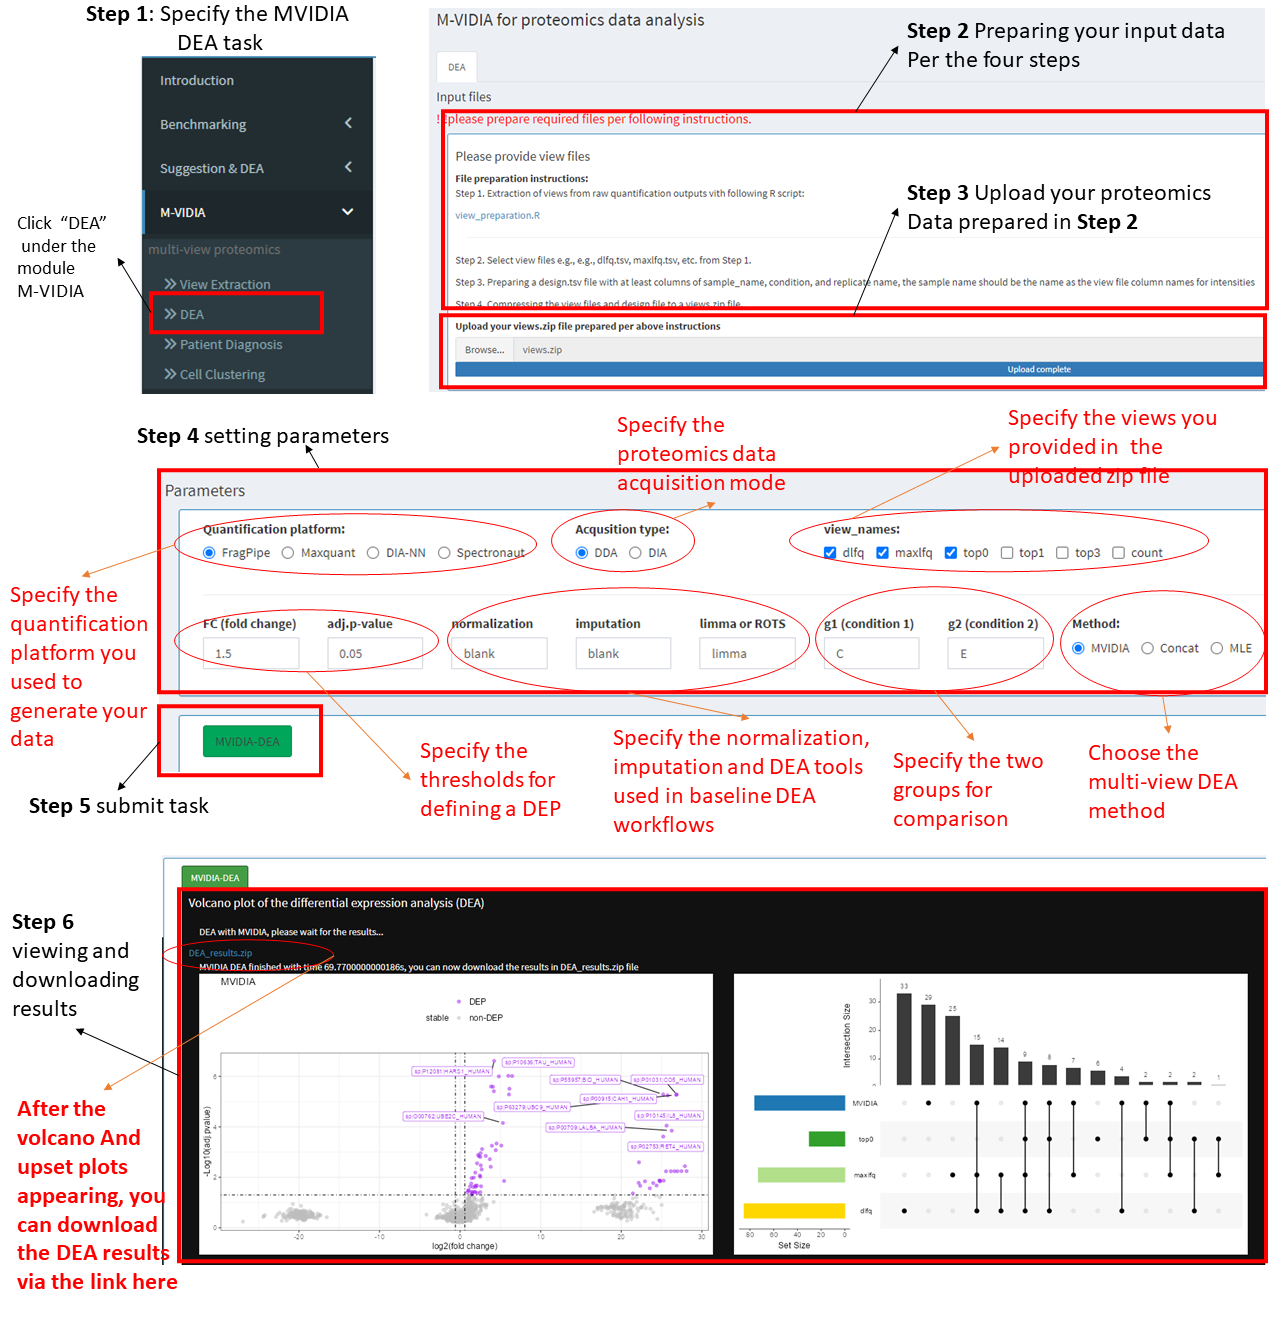
MVIDIA DEA
Step 1: Choose the task "MVIDIA-DEA" under "Multi-view Proteomics" in the left menu.
Step 2 Preparing your input data.
We provide a module helping extract views from your proteomics data and use them as inputs to MVIDIA. see "View Extraction" page.
Step 3: Upload view data.
After extracting the view data, Compressing the view files (e.g., dlfq.tsv, maxlfq.tsv, etc.) and the design file (design.tsv) to a zip file named "views.zip". Then, upload the zip file to the server.
Step 4: Setting the parameters.
A.) Please specify the parameters including:
B.) Quantification platform, e.g., FragPipe for DDA data, DIA-NN for DIA data, etc.
C.) proteomics data acqusition mode, DDA or DIA
D.) views used, 3 views are suggested, but please select at least 2 views, e.g., dlfq and maxlfq, etc.
E.) The thesholds for defining differentially expressed proteins (DEPs), including the logFC and the adj.pvalue.
F.) Specifying whehter the data should be normalized and the missing values should be imputed. Avaialbe options please see the pages in Benchmarking.
G.) Specify the group label that you are willing to compare, e.g., A, B.
H.) Choose the multi-view DEA method, MVIDIA, Concat or MLE.
Step 5: After specifying the parameters, please click the MVIDIA-DEA button to submit the task.
Step 6: Check DEA results.
After submitting the DEA task, the user should wait for a while till the task being completed. A volcano plot and the a venn plot showing the DEP overlaps obtained by single view methods and the multi-view method will be generated. The result file can be downloaded through the blue link.
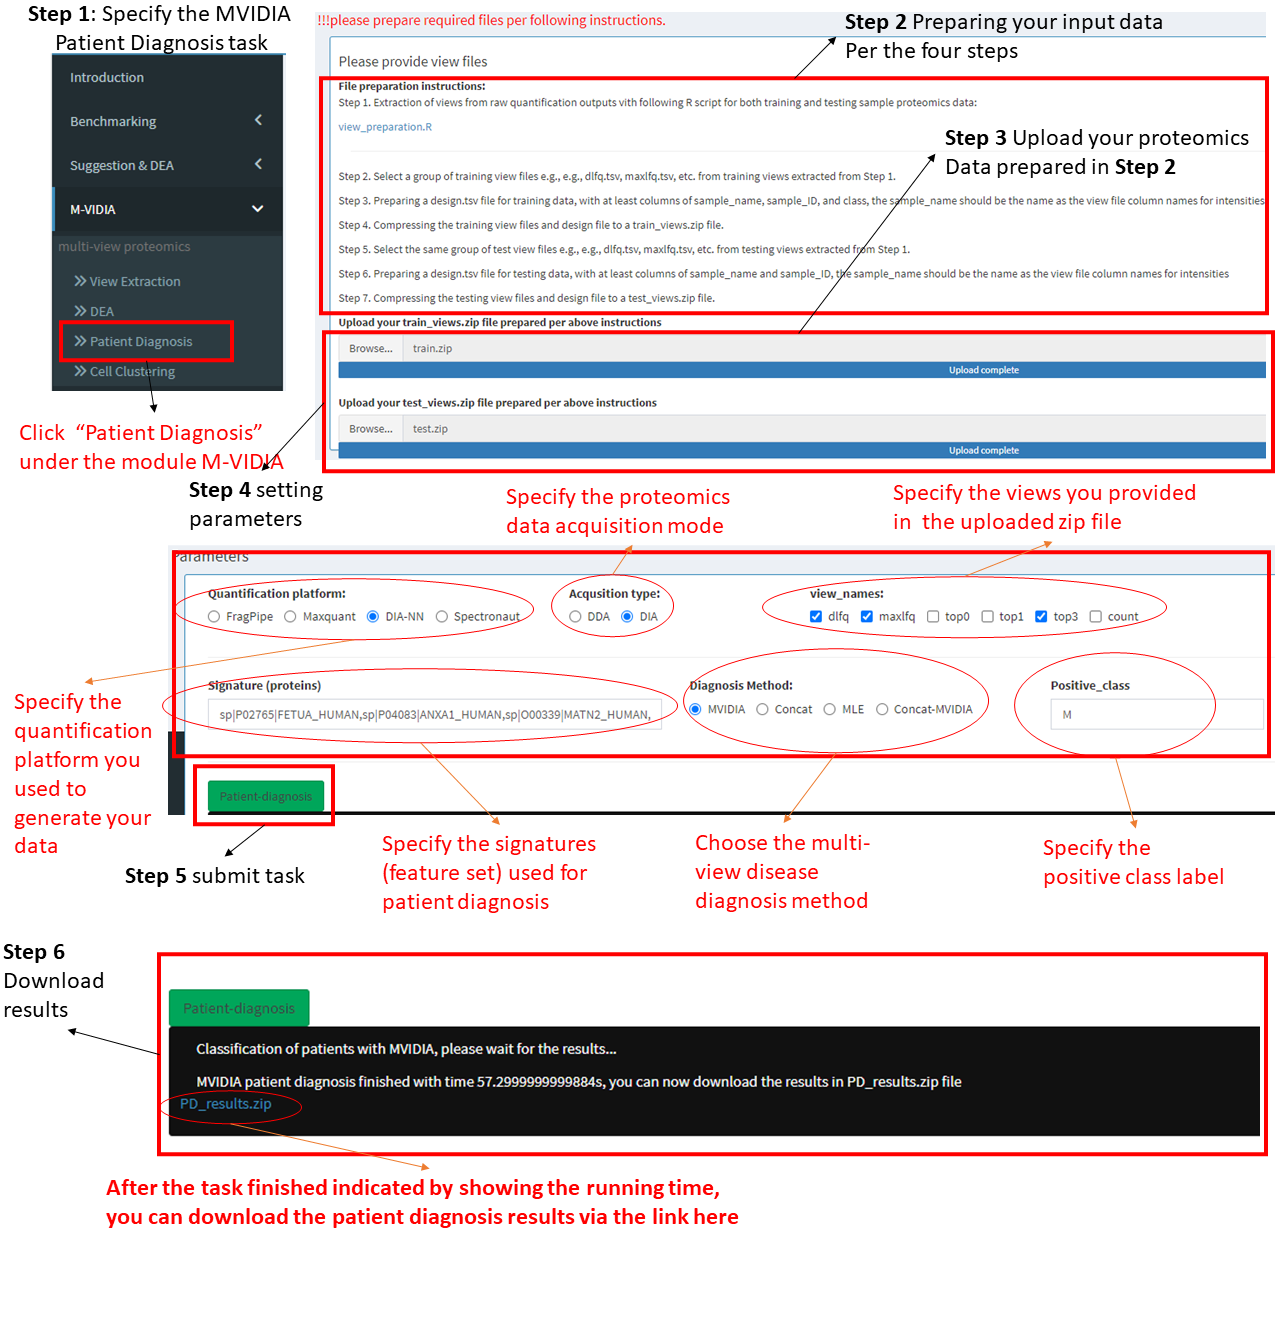
MVIDIA patient diagnosis
Step 1: Choose the task "Patient Diagnosis" under "Multi-view Proteomics" in the left menu.
Step 2 Preparing your input data.
We provide a module helping extract views from your proteomics data and use them as inputs to MVIDIA. see View Extraction page.
Step 3: Upload view data.
After extracting the view data for both training data and test data, Compressing the view files (e.g., dlfq.tsv, maxlfq.tsv, etc.) and the design file (design.tsv) to two zip files named "train.zip" and "test.zip". Then, upload the zip files to the server.
Step 4: Setting the parameters.
Please specify the parameters including:
A.) Quantification platform, e.g., FragPipe for DDA data, DIA-NN for DIA data, etc.
B.) proteomics data acqusition mode, DDA or DIA
C.) views used, 3 views are suggested, but please select at least 2 views, e.g., dlfq and maxlfq, etc.
D.) The signatures used for patient diagnosis, it is a set of proteins, can be DEPs detected by our MVIDIA-DEA.
!!! please make sure the proteins are in quotes and seperated by ",", e.g., "sp|A0A075B6S2|KVD29_HUMAN,sp|A0A075B6S5|KV127_HUMAN"E.) Choose the multi-view DEA method, MVIDIA, Concat or MLE.
F.) Specify the label of the positive class
Step 5: After specifying the parameters, please click the "Patient Diagnosis" button to submit the task.
Step 6: Check diagnosis results.
After submitting the patient diagnosis task, the user should wait for a while till the task being completed. A notification will appear showing the running time after the task being completed. The result file can be downloaded through the blue link.
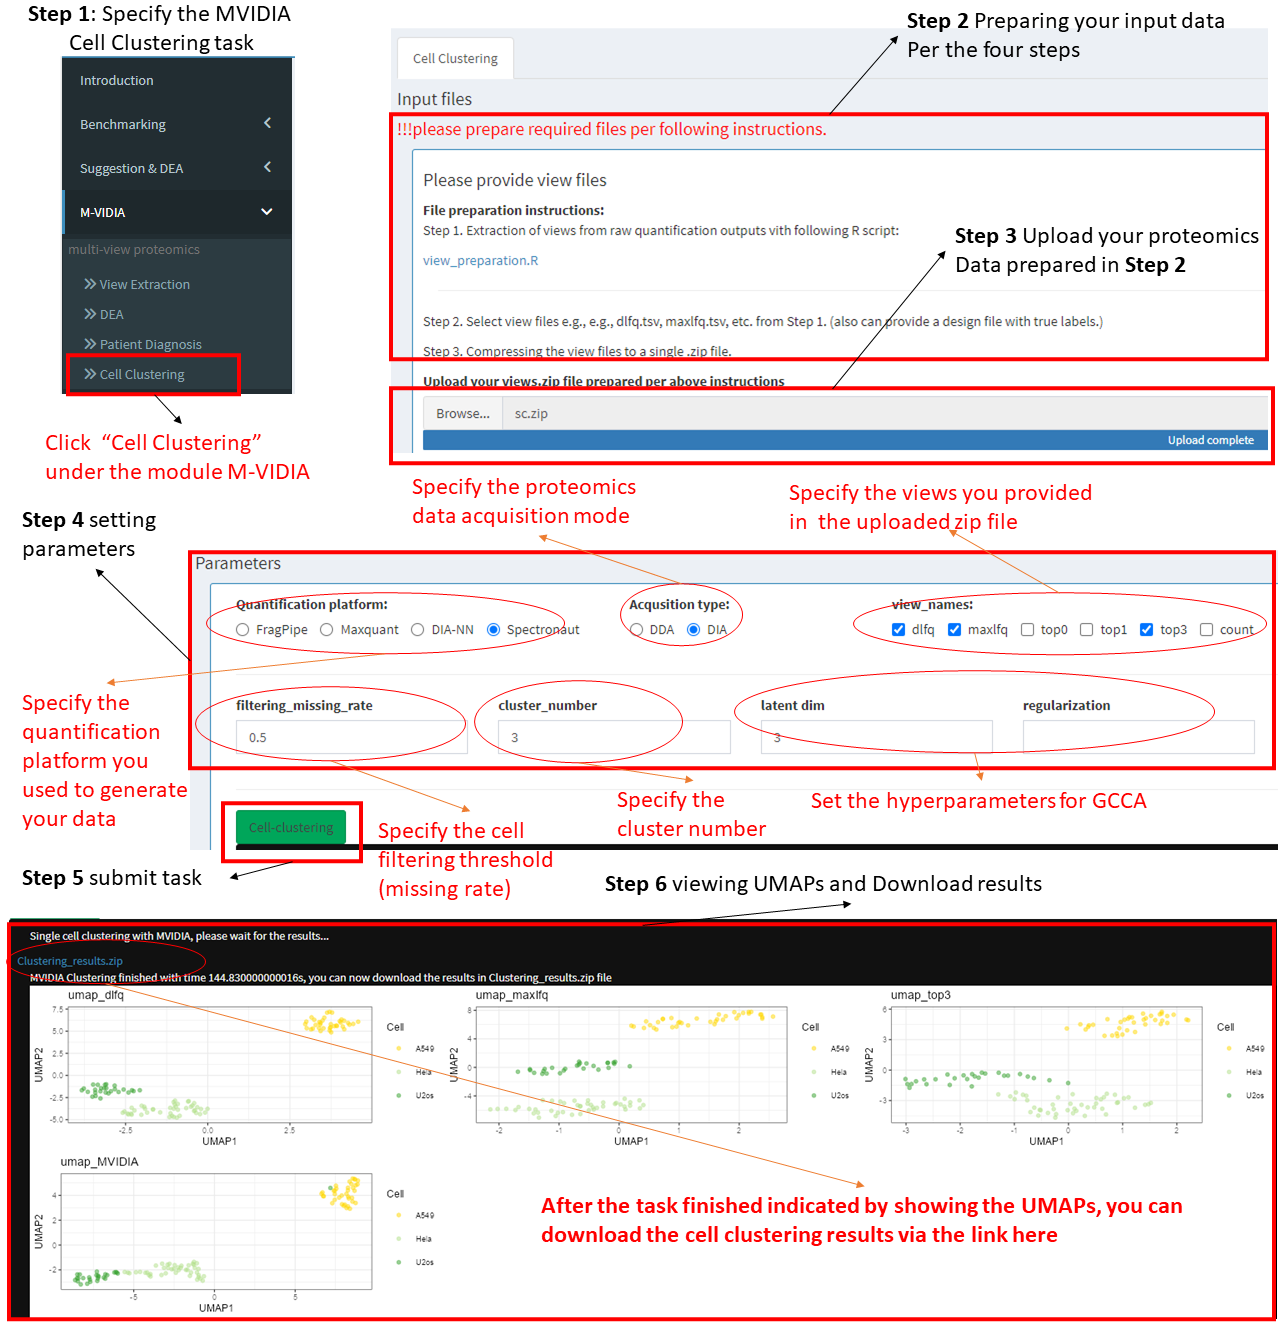
MVIDIA cell clustering
Step 1: Choose the task "Cell Clustering" under "Multi-view Proteomics" in the left menu.
Step 2 Preparing your input data.
We provide a module helping extract views from your proteomics data and use them as inputs to MVIDIA. see View Extraction page.
Step 3: Upload view data.
After extracting the view data, Compressing the view files (e.g., dlfq.tsv, maxlfq.tsv, etc.) and the design file (design.tsv) to a zip file named "sc.zip". Then, upload the zip file to the server.
Step 4: Setting the parameters.
Please specify the parameters including:
A.) Quantification platform, e.g., FragPipe for DDA data, DIA-NN for DIA data, etc.
B.) proteomics data acqusition mode, DDA or DIA
C.) views used, 3 views are suggested, but please select at least 2 views, e.g., dlfq and maxlfq, etc.
D.) Cell filtering threshold, per the missing rate.
E.) Specifying the number of clusters.
F.) Specify the hyperparameters for GCCA used for cell embedding.
Step 5: After specifying the parameters, please click the "Cell-Clustering" button to submit the task.
Step 6: Check clustering results.
After submitting the cell clustering task, the user should wait for a while till the task being completed. A notification will appear showing the running time after the task being completed. The result file can be downloaded through the blue link.
Contact Info
Contact:
OpDEAAny problem about OpDEA please contact Hui Peng:
Email: penghui@suat-sz.edu.cn
or cdph2009@163.com
Or, can email to the corresponding authors:
Jinyan Li: lijinyan@suat-sz.edu.cn;
Wilson Wen Bin Goh: wilsongoh@ntu.edu.sg
MCP
Any problem about MCP please contact Hui Peng:
Email: penghui@suat-sz.edu.cn
or cdph2009@163.com
Or, can email to the corresponding authors:
Jinyan Li: lijinyan@suat-sz.edu.cn;
Wilson Wen Bin Goh: wilsongoh@ntu.edu.sg
M-VIDIA
Any problem about MVIDIA please contact Hui Peng:
Email: penghui@suat-sz.edu.cn
or cdph2009@163.com
Or, can email to the corresponding author:
Wilson Wen Bin Goh: wilsongoh@ntu.edu.sg